I really liked last.fm’s end-of-year charts. I also really liked this analysis of Pitchfork’s scoring in 2009, just for the statistical fun. And then I thought about my favourite score-oriented website, and wondered why no-one’s done this for Eurogamer yet. I’d be the first to argue that scores in reviews aren’t that important – but everybody loves arguing about them in comments threads, and besides, they make for interesting statistics. What I’d really like would be something like the Pitchfork analysis, but looking a bit more like the last.fm site.
And then after two days I just decided to build it myself.
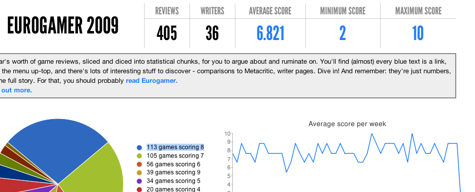
It’s relatively straightforward: a small app to explore a year’s worth of review scores, built around the pillars of reviews, writers, and scores. Most blue things are clickable; writers have pages that show their reviews, as well as their own averages, deviance from EG’s norm, and the scale of their contribution to the overall average. That latter figure is something I call influence; it took a long while to get to, and I write about it more here. Here’s Simon Parkin’s page as a good example of a writer’s page.
Reviews also have pages – here’s one for Modern Warfare 2, which show how the review compares to the site’s average, the writer’s average, and also to Metacritic. And, of course, you can see just how many games scored 7 – or any other score – if you want. Basically: have a click around.
I started two weeks ago, and guess I stopped committing in the middle of last week, but towards the endit was just front-end tweaks. It’s not been a big project at all – about an hour or two’s work a day on average, in evenings, and lunch-hours, over about ten days.
It’s not a very advanced project, and touches lots of bases I’m working with a lot right now – data analysis, visualisation, scraping. That said, it’s got some interesting stuff under the hood. I’m using Typekit for the attractive type, and it’s been a pleasure to work with. The graphs are a combination of the Google Charts API and gRaphaël, which I’ve had reasonable results from recently. gRaphaël’s strength are beautiful visualisations, rather than ultra-accurate charting, so the pair of tools are used for their strengths. Finally, it’s all deployed on Heroku, which has been a joy as ever; cloud deployment of databased apps, on dynamic hosting, as simple as pushing to a new git repo. And, for the scale of the Eurogamer tool, totally free.
So there you go. A little exploration of some numbers, which bring some interesting figures to light, and was also fun to build. It only felt right to share it. As the site says, scores aren’t everything – you should read reviews too, folks – but when you’ve got numerical data, it seems a shame not to do anything with it.
Alex | 18 Jan 2010
Awesome stuff, Tom.
Lee Maguire | 18 Jan 2010
I’m not sure a run-sequence plot works for some of this data. A writer page, Kieron Gillen‘s for example, will keep reverting to one. Only having a few points of data makes the angles of the edges meaningless.
James | 18 Jan 2010
Sweet. But, suffering as I do with a crippling disability that prevents me from looking at anything awesome without spotting potential improvements, it’d be cool if it were possible to sort by deviation from Metacritic or by platform. That way we’d have actual science to back up comment threads accusing Eurogamer of bias.
Gabe McGrath | 18 Jan 2010
@James “That way we’d have actual science to back up comment threads accusing Eurogamer of bias.”
Or, you’d have actual science to backup accusations of ‘having an opinion’ – which is different to just “giving the same score as every other reviewer/publication”.
Duncan | 19 Jan 2010
That’s ace. I’d be interested to see, too, how the average score differs on each platform.